Fall Semester World Geography Review Pages
|
Testing Schedule
Monday 12/14 1st and 3rd period exams 2nd and 4th regular day Tuesday 12/15 5th and 7th period exams 6th and 8th regular day Wednesday12/16 2nd and 4th period exams 1st and 3rd regular. day Thursday 12/17 6th and 8th period exams 5th and 7th regular day Fri 12/18 1/2 day with C Day classes all classes 20 minutes |

|
Physical Patterns and Processes
(1) Earth Sun Relationship (2) Physical Processes that Impact Regions
(3) Physical Processes that Impact the biosphere
(4) Climate (5) landforms (6) biomes (7) technology
(8) information systems
(3) Physical Processes that Impact the biosphere
(4) Climate (5) landforms (6) biomes (7) technology
(8) information systems
(1) Earth Sun Relationship
The Earth-Sun relationship is responsible for annual changes in the seasons
Analyze the two graphic images below and explain what geographic information they are displaying
The Earth-Sun relationship is responsible for annual changes in the seasons
Analyze the two graphic images below and explain what geographic information they are displaying

|

|
(2) Physical Processes that Impact Regions
(a) weather (b) tectonic forces (c) erosion (4) soil building
Analyze the three graphic images below and interpret what geographic information they are displaying
(a) weather (b) tectonic forces (c) erosion (4) soil building
Analyze the three graphic images below and interpret what geographic information they are displaying

|

|

|
(3) Physical Processes that Impact the biosphere
(a) hurricanes (b) El Nino winds (c) earthquakes (d) volcanoes
Analyze the three graphic images below and interpret what geographic information they are displaying
(a) hurricanes (b) El Nino winds (c) earthquakes (d) volcanoes
Analyze the three graphic images below and interpret what geographic information they are displaying
|

|

|
(4) Climate
These geographic factors impact
(a) elevation (b) latitude (c) wind systems (d) ocean currents (e) position on the continent (f) mountain barriers
these geographic these geographic factors
(g) temperature (h) precipitation (i) distribution of climate regions
Analyze the three graphic images below and interpret what geographic information they are displaying

|

|

|
(5) landforms
(a) tectonic forces: mountains, rift valleys, islands volcanoes (b) sand dunes
(c) fjords (d) plains (e) atolls (f) valleys (g) canyons
Analyze the three graphic images below and explain how each of the geographic features is formed
(a) tectonic forces: mountains, rift valleys, islands volcanoes (b) sand dunes
(c) fjords (d) plains (e) atolls (f) valleys (g) canyons
Analyze the three graphic images below and explain how each of the geographic features is formed

|

|

|
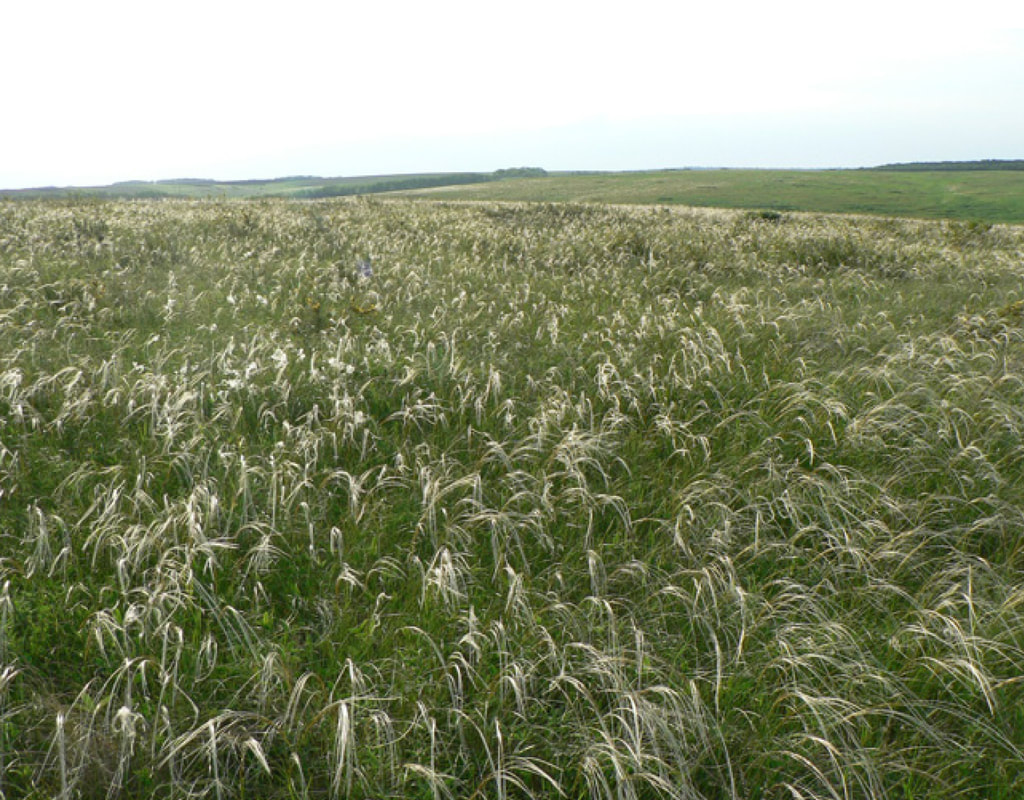
(6) biomes
(a) forests (b) deserts (c) tundra (d) grasslands
Analyze the two graphic images below and interpret what geographic information they are displaying
(a) forests (b) deserts (c) tundra (d) grasslands
Analyze the two graphic images below and interpret what geographic information they are displaying

|
|
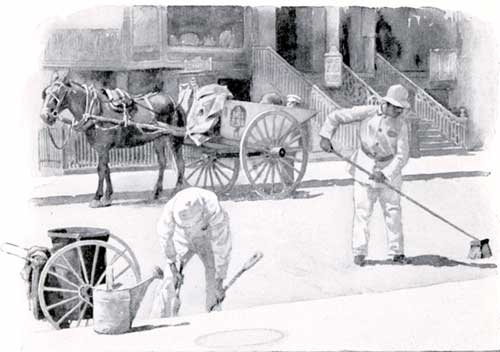
(7) technology
Innovations in transportation and energy
Analyze the three graphic images below and interpret what geographic information they are displaying
Innovations in transportation and energy
Analyze the three graphic images below and interpret what geographic information they are displaying

|

|

|
(8) information systems
(a) Global Positioning Systems (b) Geographic Information Systems
Analyze the two graphic images below and interpret what geographic information they are displaying
(a) Global Positioning Systems (b) Geographic Information Systems
Analyze the two graphic images below and interpret what geographic information they are displaying

|

|